ORIGINAL RESEARCH | https://doi.org/10.5005/jp-journals-10024-2713 |
Degree of Conversion of Nanoceramic and Microhybrid Composites Activated by Different Polymerization Modes at Different Intervals: An In Vitro Comparative Study
1–3Department of Restorative Dentistry, Riyadh Elm University, Riyadh, Kingdom of Saudi Arabia
4Department of Restorative Dentistry, College of Dentistry, King Khalid University, Abha, Kingdom of Saudi Arabia
Corresponding Author: Yasser M Al-Qahatani, Department of Restorative Dentistry, Riyadh Elm University, Riyadh, Kingdom of Saudi Arabia, Phone: +966 502227671, e-mail: yasser.alqahtani@student.riyadh.edu.sa
How to cite this article Al-Qahatani YM, Al-Omari M, Mathew ST, et al. Degree of Conversion of Nanoceramic and Microhybrid Composites Activated by Different Polymerization Modes at Different Intervals: An In Vitro Comparative Study. J Contemp Dent Pract 2020;21(1):22–27.
Source of support: Nil
Conflict of interest: None
ABSTRACT
Introduction: This is an in vitro study to evaluate the degree of conversion (DC) of nanoceramic and microhybrid composites activated by different polymerization modes at different intervals.
Aim: To determine the DC of two resin composites at different time intervals and modes of polymerization on DC.
Materials and methods: Two commercially available composite resins—nanoceramic (Ceram X, Dentsply) and microhybrid (Spectrum TPH, Dentsply)—were used in this study. A total of 80 cylindrical samples (n = 40 each) were made by packing the composites in one increment into (5 × 2 mm) Teflon molds and cured using a light-emitting diode (LED) at an irradiance of 1,200 mW/cm2. Each group was further divided into two groups (n = 20) based on the curing modes (20 seconds, 40 seconds). These 20 samples were further subdivided (n = 10) based on the time interval (2 days, 7 days). Degree of conversion was assessed by Fourier-transform infrared spectrophotometer (FTIR) using a direct technique (attenuated total reflectance) on the top surface of the samples. Degree of conversion was measured for samples cured for 20 seconds (n = 10) and 40 seconds (n = 10) after 2 days and 7 days during which the samples were stored in an incubator at 37°C, 90% ± 10% relative humidity. The results obtained were statistically analyzed using two-way and three-way analysis of variance (ANOVA) test and p value set at (<0.005) significance level.
Results: Degree of conversion for the tested composites varied between 44% and 55% for Ceram X and 42% and 45% for Spectrum TPH. A significant difference was observed in DC for Ceram X samples for different polymerization modes (20 seconds and 40 seconds) as well as at 2–7 days measurement, whereas Spectrum TPH did not show any significant difference for polymerization modes.
Conclusion: Ceram X demonstrated high DC values compared with that of Spectrum TPH with regard to two different polymerization modes.
Clinical significance: Lesser the time required for conversion and less the residual monomer left, better is the prognosis of the restoration, and better is the patient satisfaction.
Keywords: Ceram X, Degree of conversion, Fourier-transform infrared spectroscopy, Spectrum TPH.
INTRODUCTION
Recently, resin composite reclamation has been sought after in esthetic dentistry. In this manner, there have been endeavors to continually improve the clinical, mechanical, and esthetic properties of this material. The few elements impacting the properties of resin composites are polymeric matrix composition, filler molecule type, and content, and the degree of conversion (DC) after the polymerization response, which can impact the dissolvability and sorption behavior of resin composites.1 The degree of curing composite resins, spectral distribution, and intensity of the curing light used, as well as the shade or color, stability, opacity, and chemical composition of the resin-based composite itself, are the prime considerations when choosing these materials for restorations. In addition, both the composite resin components and their curing time have a significant association with the resulting level of polymerization. Also, both the composite segments and its relieving time have a critical relationship with the subsequent degree of polymerization.2 The appraisal of DC% polymerization progress is viewed as a helpful instrument in describing and understanding the polymerization kinetics utilizing diverse composite formulations and restoration techniques.3
Light initiation that uses a high introductory irradiance gives a higher DC. However, this initiation mode may incite a high shrinkage worry in the material, thus increasing marginal gap formation at the cavity wall–resin composite interface. Soft-start light-activation modes have been introduced in an attempt to overcome this drawback in composite polymerization.4,5
The physical and mechanical properties of the dental composite are influenced by the degree of change. The lower level of transformation leads to unwanted results with deficient properties, diminished bond qualities, expanded breakdown at the edges, diminished biocompatibility, more prominent staining, and corruption, poor wear obstruction, and color stability, less holding grip, and minor micro leakage.
Notwithstanding numerous reports about the impacts of light-emitting diode (LED) on the composite resin, most examinations have concentrated distinctly on 24-hour investigations. However, the mechanical properties of the resin composite immediately after light activation deserve some concern as the restorative material is submitted to all stress-related to finishing procedures and occlusal adjustment.6 For this reason, it is crucial to determine the DC values of resin composite for a longer duration. Faced with these findings, the purpose of this study was to investigate the influence of LED light source on the DC between new nanoceramic and microhybrid resin composites exposed to light at two different polymerization modes and measured at different intervals. There is a severe paucity of data related to DC of different composite resins, with different polymerization modes and at different times, hence the hypothesis associated with the present study is that nanoceramic resins are better cured as compared with microhybrid resins.
MATERIALS AND METHODS
The study was conducted after obtaining approval from the Institutional Ethical Committee. This study evaluated the DC% of two composite resins, namely Ceram.X universal nanoceramic composite and Spectrum TPH microhybrid composite. The composites are listed in Table 1. Both the composite resins were of A2 shade. The composite samples were light-cured using four Bluephase G2 LED curing units (batch no. 215502, wavelength range 385–515 nm, power density 1,200 mW/cm2 ± 10% with tip diameter ~0.61 cm2 and circular tip design). The light output of the curing unit was assessed regularly after every five exposures using a light radiometer device (Bluephase Meter; Ivoclar Vivadent, Schaan Liechtenstein, Germany).
| Composite | Manufacturer | Batch no. | Composition | Filler % |
|---|---|---|---|---|
| Ceram X | Dentsply DeTery, Germany | K101688-02 | Methacrylate-modified polysiloxane dimethacrylate resins | The inorganic fillers amount to 72–73 weight% |
| Fluorescent pigment | (48–50 volume%) | |||
| UV stabilizer | ||||
| Stabilizer | ||||
| Camphorquinone | ||||
| EDMAB | ||||
| Bis-(4-methyl-phenyl)-iodoniumhexafluorophosphate | ||||
| Barium-aluminum-borosilicate glass | ||||
| Ytterbium fluoride | ||||
| Iron and titanium oxide pigments | ||||
| Spectrum TPH | Dentsply DeTery, Germany | K101696-00 | Bis-GMA | The inorganic fillers amount to 76 weight% |
| Bis-EMA | (53 volume%) | |||
| TEGDMA | ||||
| Photo initiators | ||||
| Stabilizers | ||||
| Barium aluminum borosilicate | ||||
| Barium fluoroaluminoborosilicate | ||||
| Highly dispersed silicon dioxide |
Bis-EMA, ethoxylated bisphenol A-glycol dimethacrylate; Bis-GMA, bisphenol A-glycidyl methacrylate; EDMAB, ethyl-4-dimethylamino benzoate; TEGDMA, triethylene glycol dimethacrylate
Fourier-transform infrared spectrophotometer (Thermo Electron Scientific Instruments Corporation, Waltham, Massachusetts, USA) was used to assess DC%. The specifications for the same are mentioned in Table 2.
A total of 80 cylindrical samples of composites (5 mm diameter × 2 mm thickness) were fabricated using a Teflon mold and randomly divided into eight subgroups.
A Mylar strip (Frasaco, Tettnang, Germany) was placed on top of a microscopic glass slide on which the mold was placed. The mold was filled completely with Ceram.X or Spectrum TPH composite material, and the top surface of the mold was covered with one more Mylar strip followed by microscopic glass slide (1 mm thickness). The glass slide was slightly compressed to extrude the excess material out of the mold. The light cure unit (Bluephase G2) was used to polymerize the composite samples in soft start mode at 1,200 mW/cm2 light intensity by positioning the light guide tip to be in contact with the glass slide on the top surface of the specimen and to standardize the distance from the light cure tip. The Mylar strips gave a smooth finish for the sample by avoiding any incidence of scattering of the light beam. To standardize the sample thickness, a digital caliper (Ultra Cal Mark III; Fowler Sylvac, Switzerland) was used. After polymerizing, the samples were removed from the mold, and placed in a lightproof dark container and stored in an incubator (Cultura; Ivoclar Vivadent) for 2 days and 7 days at 37°C, 90% ± 10% relative humidity before DC% testing.
Flowchart 1 shows various group divisions of the study.
After cleaning and the background is corrected, the composite samples (polymerized) were placed onto the small crystal area. Once the composite samples have been placed on the crystal area, the pressure arm was positioned over the crystal/sample area. Force was applied to the sample, pushing it onto the diamond surface. The data were obtained by Spectrum™ FT-IR software, “Preview Mode,” which allows the quality of the spectrum to be monitored in real-time while fine-tuning the exerted force. The pressure was applied until the strongest spectral bands were obtained with an intensity extending beyond 70% T.
The composite samples (unpolymerized) (n = 4) of each composite resin were placed in the crystal area and then pressed in a similar way, and then a spectrum was obtained with the same parameters as for the polymerized specimens.
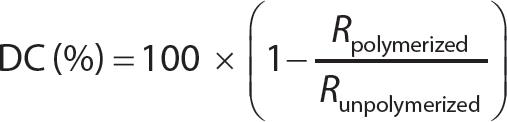
The number of double carbon bonds that are converted into single bonds provides the DC% of the composite resin and helps to measure the DC. The FTIR spectra of both uncured and cured samples were analyzed using an accessory of the diffuse reflectance. The measurements were recorded in the absorbance operating under the following conditions: 32 scans, a 4 cm−1 resolution, and a 400–4,000 cm−1 wavelength. Degree of conversion was determined by estimating the changes in peak height ratio of the absorbance intensities of aliphatic Cm̂C peak at 1,637 cm−1 and that of an internal standard peak of aromatic Cm̂C at 1,608 cm−1 during polymerization, in relation to the uncured material.
Degree of conversion % for each specimen was calculated using the following equation:7
| Optical resolution | 0.09 cm−1 |
| Wavenumber precision | 0.01 cm−1 |
| Slowest linear scan velocity | 0.158 cm/s |
| Fastest linear scan velocity | 6.33 cm/s |
| Number of scan velocities | 15 |
| Liquid nitrogen-cooled detector hold time | 8 hours |

Flowchart 1: Various group divisions of the study
The data obtained were computed and statistically analyzed using IBM SPSS Statistics version 20 (Statistical Package for the Social Sciences; SPSS Inc., Chicago, IL, USA). Two-way and three-way ANOVA were used in testing statistical significance for the effect of the material, the curing times, and duration. The significance level was set at p ≤ 0.05.
RESULTS
The present study compared the DC% between nanoceramic composite Ceram X and microhybrid composite Spectrum TPH cured for 20 seconds and 40 seconds and DC% measured at 2 days and 7 days after photoactivation.
The comparison of Ceram X measured at 2 days and 7 days cured for 20 seconds and 40 seconds, respectively, showed a statistically significant difference (p = 0.000). The mean was highest at 7 days interval in both curing times of 20 seconds (50.53) and 40 seconds (55.44). The mean difference between 2 days and 7 days interval at 20 seconds and 40 seconds curing time was 6.86 and 7.01, respectively. Moreover, this mean-difference was statistically significant (p < 0.05) (Table 3).
The mean difference at 2 days between 20 seconds and 40 seconds was statistically significant in Ceram.X (p = 0.001) but was statistically not significant in Spectrum TPH (p = 0.168). The mean difference at 7 days between 20 seconds and 40 seconds was statistically significant in Ceram.X (p = 0.002) but was statistically not significant in Spectrum TPH (p = 0.116) (Table 4).
There was no statistically significant difference between Ceram.X and Spectrum TPH cured for 20 seconds and measured at 2 days (p = 0.168), but it was statistically significant when cured for 20 seconds and measured at 7 days (p < 0.000).
The mean difference (5.991) between Ceram.X and Spectrum TPH was statistically significant (p < 0.05) (Table 5).
Three-way ANOVA shows a statistically significant difference in DC (p < 0.05). However, the interaction effect was statistically significant only between composite resin (A) and curing time (B) and composite resin (A) and duration (C) (p < 0.05) (Table 6).
| Composite | Interval (days) | Curing time (seconds) | Mean | Standard deviation | Std. error | 95% confidence interval | p value | |
|---|---|---|---|---|---|---|---|---|
| Lower bound | Upper bound | |||||||
| Ceram X | 2 | 20 | 43.67 | 3.81 | 1.20 | 41.24 | 46.11 | 0.000* |
| 7 | 20 | 50.53 | 6.57 | 1.20 | 48.09 | 52.96 | ||
| 2 | 40 | 48.43 | 3.79 | 0.82 | 46.78 | 50.08 | 0.000* | |
| 7 | 40 | 55.44 | 3.48 | 0.82 | 53.79 | 57.09 | ||
| Spectrum TPH | 2 | 20 | 41.66 | 4.47 | 0.85 | 39.95 | 43.37 | 0.140 |
| 7 | 20 | 43.95 | 2.91 | 0.85 | 42.24 | 45.66 | ||
| 2 | 40 | 43.30 | 6.25 | 1.29 | 40.70 | 45.91 | 0.482 | |
| 7 | 40 | 45.20 | 5.20 | 1.29 | 42.60 | 47.81 | ||
* p < 0.05
| Composite resin | Curing time (days) | Interval (seconds) | Mean | Standard deviation | p value |
|---|---|---|---|---|---|
| Ceram.X | 2 | 20 | 43.67 | 3.81 | 0.001* |
| 40 | 48.42 | 3.79 | |||
| Spectrum TPH | 2 | 20 | 41.65 | 4.47 | 0.168 |
| 40 | 43.30 | 6.25 | |||
| Ceram.X | 7 | 20 | 50.52 | 6.57 | 0.002* |
| 40 | 55.44 | 3.48 | |||
| Spectrum TPH | 7 | 20 | 43.94 | 2.91 | 0.116 |
| 40 | 45.20 | 5.20 |
* p < 0.05
| Composite resin | Mean | Std. error | 95% confidence interval | p value | |
|---|---|---|---|---|---|
| Lower bound | Upper bound | ||||
| Ceram.X | 49.51 | 0.52 | 48.47 | 50.56 | 0.000* |
| Spectrum TPH | 43.52 | 0.52 | 42.48 | 44.57 | |
* p < 0.05
| Dependent variable: degree of conversion | |||||
|---|---|---|---|---|---|
| Source | Sum of squares | df | Mean square | F | p value |
| Corrected Model | 2995.766a | 7 | 427.967 | 19.104 | 0.000 |
| Intercept | 346288.434 | 1 | 346288.434 | 15458.108 | 0.000 |
| A | 1435.649 | 1 | 1435.649 | 64.087 | 0.000 |
| B | 394.733 | 1 | 394.733 | 17.621 | 0.000 |
| C | 815.585 | 1 | 815.585 | 36.407 | 0.000 |
| A*B | 114.794 | 1 | 114.794 | 5.124 | 0.025 |
| A*C | 234.109 | 1 | 234.109 | 10.450 | 0.002 |
| B*C | 0.137 | 1 | 0.137 | 0.006 | 0.938 |
| A*B*C | 0.757 | 1 | 0.757 | 0.034 | 0.854 |
| Error | 3405.064 | 152 | 22.402 | ||
| Total | 352689.263 | 160 | |||
| Corrected Total | 6400.830 | 159 | |||
A, composite resin; B, curing time; C, interval
* Interaction
DISCUSSION
The present examination assessed the DC% of two composite resins to be specific, Ceram X and Spectrum TPH, cured with an LED light unit with polymerization times of 20 seconds and 40 seconds at 2 days and 7 days. Both the composite resins were of A2 conceal to limit any impact of shading on polymerization of the composites.8,9
In the present examination, DC was assessed by FTIR as it empowers checking the curing procedure during polymerization and furthermore gives an immediate estimation of unreacted methacrylate groups, and it has been acknowledged as a dependable method for distinguishing the Cm̂C bond extending vibrations before and after polymerization of composite resins.1,10
The aftereffects of the present investigation showed that DC estimations of Ceram X acquired are similar to the study led by Prasanna et al.,11 who revealed a DC% of 50–52% when contrasted with 43–55% in our examination independent of time presentation. However, Jafarzadeh et al.12 found values for Ceram X extending from 36% to 65% when cured with quartz–tungsten–halogen (QTH) light for 20 seconds and demonstrated a higher DC running from 65 to 78% when restored with LED, paying little heed to the profundity of the fix of the example. This result conflicted with the results of the present investigation. In our examination, DC% of Spectrum TPH cured for 40 seconds detailed DC% of 41–47%, which is similar to the consequences of the study by Rahiotis et al.,4 which revealed DC% of 46.2%. On the contrary, Ozturk et al.13 obtained the values of 59.8% in contrast with 41–47% in our examination independent of the introduction time and time interval. This could be the result of the different spectral distributions and intensity of the curing light used.
A few specialists are of the view that the nano filled composite pitch demonstrates a lower DC% contrasted with microhybrid composites.14,15 The equivalence is clarified by the way that composite resins with nanoparticles demonstrated an altogether lower light transmittance in contrast with small-scale mixture composites in which the filler range is in micrometers. The light going through the resin composite is dispersed by the little filler particles, and light transmittance is decreased. In nano-filled composites, the light power is constricted as a result of the light-dispersing impact, in this way diminishing the DC. On the contrary, in the half and half composite, the light transmittance is higher, prompting high DC values.16,17
The distinction in the DC estimations of the composites in the present examination could be identified with the synthetic structure of the materials. Ceram X contains granulated round submicron glass fillers, which could have permitted even more light transmittance in contrast with Spectrum TPH, and consequently, the higher DC esteems. Notwithstanding the fillers, the monomer substance of the composites could be the contributing element for the distinctions in DC esteems between the materials.
It has been accounted that the proportion of filler present in the resins impacts DC. The higher filler rate can prompt insufficient restoration of the composites.18 The two composites utilized in our examination had fillers running between 72% and 76% by weight. So the result of the present investigation conflicted with that by Yoon et al.,18 which is that filler rate could impact the DC. The investigation upheld the perspective of Price et al.,19 who revealed that the connection between filler rate and light transmission was not even.
The composites in this investigation were cured utilizing an LED unit either for 20 seconds or for 40 seconds at 1200 mW/cm2 light power with soft start mode. The primary explanation behind utilizing this new age of LED unit was the way that higher thickness irradiance would improve the curing adequacy of composite resins.20 Additionally, they appear to be exceptionally effective in contrast with QTH restoring units and dispose of the requirement for cooling fans. Warming of the illuminated composite materials by LED lights is likewise minimal.13 Furthermore, during polymerization; the composite is first submitted to a low irradiance pursued by higher irradiance, in this way permitting shrinkage stress, by polymer chain relaxation. It has likewise been demonstrated that soft-start polymerization mode does not diminish the DC of dental composites.16 The DC% of the composite materials is proportional to light exposure time,21 and accordingly, the level of restoration is expanded if the light introduction time of the materials is increased.22 The present study answered both, as the composite materials showed higher DC rates when presented to 40 seconds curing time when contrasted with 20 seconds curing time.
The higher DC% in the samples exposed to increased curing time could be related to the greater light energy used in the material. These discoveries were in concurrence with the discoveries of another investigation that showed that when light vitality was diminished, the DC decreased considerably.23 Previous examinations have revealed that the noteworthy polymerization was accomplished inside 24 hours of exposure to light restoration and very little change in postfix DC esteems, which was in logical inconsistency with the consequence of our investigation. Ceram.X composite demonstrated a huge change in DC esteems from 2 days to 7 days. The expansion in postfix DC esteems could be clarified by the way that a few segments of the radicals created during composite polymerization are caught inside the heterogeneous system and can endure for increased periods. As time progresses, the caught radicals can experience pendant gatherings, bringing about extra conversion.24
CONCLUSION
Within the limitations of the present investigation, the result is that the nanoceramic composite Ceram.X exhibited high DC in contrast with that of microhybrid Spectrum TPH with respect to diverse polymerization modes. DC was significantly altered by the time interval and mode of polymerization. Degree of conversion % test is a dependable test to evaluate the biocompatibility of composite and physical properties by estimation of its leftover unresponded monomer.
REFERENCES
1. Eliades GC, Vougiouklakis GJ, Caputo AA. Degree of double bond conversion in light-cured composites. Dent Mater 1987;3(1):19–25. DOI: 10.1016/S0109-5641(87)80055-6.
2. Aravamudhan K, Floyd CJ, Rakowski D, et al. Light-emitting diode curing light irradiance and polymerization of the resin-based composite. J Am Dent Assoc 2006;137(2):213–223. DOI: 10.14219/jada.archive.2006.0147.
3. Alshali RZ, Silikas N, Satterthwaite JD. Degree of conversion of bulk-fill compared to conventional resin-composites at two-time intervals. Dent Mater 2013;29(9):e213–e217. DOI: 10.1016/j.dental.2013.05.011.
4. Rahiotis C, Kakaboura A, Loukidis M, et al. Curing efficiency of various types of light-curing units. Eur J Oral Sci 2004;112(1):89–94. DOI: 10.1111/j.0909-8836.2004.00092.x.
5. Silva EMD, Almeida GS, Poskus LT, et al. Relationship between the degree of conversion, solubility and salivary sorption of a hybrid and a nano filled resin composite. J Appl Oral Sci 2008;16(2):161–166. DOI: 10.1590/S1678-77572008000200015.
6. Truffier-Boutry D, Demoustier-Champagne S, Devaux J, et al. A physico-chemical explanation of the post-polymerization shrinkage in dental resins. Dent Mater 2006;22(5):405–412. DOI: 10.1016/j.dental.2005.04.030.
7. Rueggeberg FA, Hashinger DT, Fairhurst CW. Calibration of FTIR conversion analysis of contemporary dental resin composites. Dent Mater 1990;6(4):241–249. DOI: 10.1016/S0109-5641(05)80005-3.
8. Bayne SC, Heymann HO, Swift EJJr. Update on dental composite restorations. J Am Dent Assoc 1994;125(6):687–701. DOI: 10.14219/jada.archive.1994.0113.
9. Hervas-Garcia A, Martinez-Lozano MA, Cabanes-Vila J, et al. Composite resins. A review of the materials and clinical indications. Med Oral Patol Oral Cir Bucal 2006;11(2):E215–E220.
10. Imazato S, Tarumi H, Kobayashi K, et al. Relationship between the degree of conversion and internal discoloration of light-activated composite. Dent Mater J 1995;14(1):23–30. DOI: 10.4012/dmj.14.23.
11. Prasanna N, Pallavi Reddy Y, Kavitha S, et al. Degree of conversion and residual stress of preheated and room-temperature composites. Indian J Dent Sci 2007;18(4):173–176. DOI: 10.4103/0970-9290.35827.
12. Jafarzadeh TS, Erfan M, Behroozibakhsh M, et al. Evaluation of polymerization efficacy in composite resins via FT-IR spectroscopy and Vickers microhardness test. J Dent Res Dent Clin Dent 2015;9(4):226–232. DOI: 10.15171/joddd.2015.041.
13. Ozturk B, Cobanoglu N, Cetin AR, et al. Conversion degrees of resin composites using different light sources. Eur J Dent 2013;7:102–109.
14. Ribeiro BC, Boaventura JM, Brito-Goncalves J, et al. Degree of conversion of nanofilled and microhybrid composite resins photo-activated by different generations of LEDs. J Appl Oral Sci 2011;20(2):212–217. DOI: 10.1590/S1678-77572012000200015.
15. Da Silva GR, Simamoto-Junior PC, da Mota AS, et al. Mechanical properties of light-curing composites polymerized with different laboratory photo-curing units. Dent Mater J 2007;26(2):217–223. DOI: 10.4012/dmj.26.217.
16. Da Silva EM, Poskus LT, Guimaraes JG, et al. Influence of light polymerization modes on degree of conversion and crosslink density of dental composites. J Mater Sci Mater Med 2008;19(3):1027–1032. DOI: 10.1007/s10856-007-3220-5.
17. Arikawa H, Fujii K, Kanie T, et al. Light transmittance characteristics of light-cured composite resins. Dent Mater 1998;14(6):405–411. DOI: 10.1016/S0300-5712(99)00014-7.
18. Yoon TH, Lee YK, Lim BS, et al. Degree of polymerization of resin composites by different light sources. J Oral Rehabil 2002;29(12):1165–1173. DOI: 10.1046/j.1365-2842.2002.00970.x.
19. Price RB, Rizkalla AS, Hall GC. Effect of stepped light exposure on the volumetric polymerization shrinkage and bulk modulus of dental composites and an unfilled resin. Am J Dent 2000;13(4):176–180.
20. Rahiotis C, Patsouri K, Silikas N, et al. Curing efficiency of high-intensity light-emitting diode (LED) devices. J Oral Sci 2010;52(2):187–195. DOI: 10.2334/josnusd.52.187.
21. Rastelli ANS, Jacomassi DP, Bagnato VS. Effect of power densities and irradiation times on the degree of conversion and temperature increase of a microhybrid dental composite resin. Laser Phys 2008;18(9):1074–1079. DOI: 10.1134/S1054660X08090132.
22. Yue C, Tantbirojn D, Grothe RL, et al. The depth of cure of clear versus opaque sealants as influenced by curing regimens. J Am Dent Assoc 2009;140(3):331–338. DOI: 10.14219/jada.archive.2009.0163.
23. Silikas N, Eliades G, Watts D. Light intensity effects on resin-composite degree of conversion and shrinkage strain. Dent Mater 2000;16(4):292–296. DOI: 10.1016/S0109-5641(00)00020-8.
24. Burtscher P. Stability of radicals in cured composite materials. Dent Mater 1993;9(4):218–221. DOI: 10.1016/0109-5641(93)90064-W.
________________________
© The Author(s). 2020 Open Access This article is distributed under the terms of the Creative Commons Attribution 4.0 International License (https://creativecommons.org/licenses/by-nc/4.0/), which permits unrestricted use, distribution, and non-commercial reproduction in any medium, provided you give appropriate credit to the original author(s) and the source, provide a link to the Creative Commons license, and indicate if changes were made. The Creative Commons Public Domain Dedication waiver (http://creativecommons.org/publicdomain/zero/1.0/) applies to the data made available in this article, unless otherwise stated.