ORIGINAL RESEARCH | https://doi.org/10.5005/jp-journals-10024-2942 |
Dimensional and Positional Associations between the Mandibular Condyle and Glenoid Fossa: A Three-dimensional Cone-beam Computed Tomography-based Study
Department of Maxillofacial Surgery and Diagnostic Sciences, College of Dentistry, Jazan University, Jazan, Kingdom of Saudi Arabia
Corresponding Author: Abeer A Almashraqi, Department of Maxillofacial Surgery and Diagnostic Sciences, College of Dentistry, Jazan University, Jazan, Kingdom of Saudi Arabia, Phone: +966502210865, e-mail: abeerradiology@gmail.com
How to cite this article Almashraqi AA. Dimensional and Positional Associations between the Mandibular Condyle and Glenoid Fossa: A Three-dimensional Cone-beam Computed Tomography-based Study. J Contemp Dent Pract 2020;21(10):1075–1083.
Source of support: Nil
Conflict of interest: None
ABSTRACT
Aim: This retrospective cross-sectional study investigated the dimensional and positional associations between the mandibular condyle and glenoid fossa (GF) using cone-beam computed tomography (CBCT).
Materials and methods: Seventy female subjects [140 temporomandibular joints (TMJs)] were divided into two groups. Group I included 35 subjects with normal facial profiles (NFPs) in which the soft tissue glabella, subnasal point, and the soft tissue chin are almost in the same straight line, while the 35 subjects in group II had abnormal facial profiles (AFPs) in which the same imaginary line is either convex or concave indicating variation from standard norms. Three-dimensional volume analyses were performed on CBCT images by digitizing all landmarks in three orthogonal planes to measure the dimensional and positional parameters of the condyle and GF. Then the Pearson’s correlation coefficient was used to identify associations between different condyle and GF parameters.
Results: Sagittal condylar surface area was significantly associated with all dimensional parameters of the GF (GF height, width, and surface area, condylar width, and the GF width and between the axial and coronal condylar surface area with GF height and GF width) on the right and left sides of both groups (p values ranging from 0.000 to 0.028). Positional associations were detected between the anteroposterior and mediolateral GF positions and the corresponding position of the mandibular condyles and between the anteroposterior condylar position and the vertical GF position on both sides of both groups (p values ranged from 0.000 to 0.015).
Conclusion: There is a strong association between the mandibular condyle and GF in both positional and dimensional measurements in patients with normal and abnormal facial profiles.
Clinical significance: Understanding the associations between the mandibular condyle and GF facilitates optimization of the treatment outcomes by increasing occlusal harmony and stability after orthodontic treatment, orthognathic surgery, or any prosthetic replacement.
Keywords: Cone-beam computed tomography, Mandibular condyle, Mandibular fossa, Three-dimensional imaging.
INTRODUCTION
The temporomandibular joint (TMJ) is one of the most important and complex structures in the maxillofacial region. It is composed of the mandibular condyle, glenoid fossa (GF) (mandibular fossa), articular tubercle, disc, masticatory muscles, and ligaments. The TMJ plays an important role in mandibular movement, occlusion harmony, and stable outcome after orthodontic procedures, orthognathic surgery, or any prosthetic replacement (fixed or removable prosthesis including dental implant).1–5 Moreover, any changes in TMJ morphology or its structural position can cause temporomandibular disorders (TMDs).6 Hence, a thorough understanding of the morphology, position, and associations between different TMJ structures will facilitate optimizing treatment outcomes.
Many imaging modalities have been used to evaluate the morphological and positional structures of soft and hard TMJ structures including conventional radiography, magnetic resonance imaging (MRI), multidetector computed tomography (MDCT), and cone-beam computed tomography (CBCT).7,8 Among them, MRI is considered the best imaging modality to assess the soft tissue structures of the TMJ,7,8 while MDCT and CBCT are used to precisely evaluate the hard tissue structures.9,10 However, CBCT’s low radiation dose and high spatial resolution render it the imaging modality of choice to assess TMJ hard structures.11
Many studies have investigated the morphology and position of different TMJ structures, while other research focused on dimensional and positional differences according to age and ethnic groups.12–16 Moreover, other studies have searched for associations between the mandibular condyle, GF, and TMDs; they found associations between morphological and positional changes to the mandibular condyle, GF, and TMDs.15,17,18 On the other hand, other studies found that differences in the dimensions and positions of the condylar head and GF correlated with skeletal class and vertical facial proportion.19,20
Studies investigating the growth and development of the mandibular condyle and GF found that the continuation but not initiation of the latter is associated with the presence of the former.21–23 However, whether the associated growth of the mandibular condyle and GF is reflected in dimensional and positional associations remains unknown. To date, no studies have examined dimensional and positional associations between the mandibular condyle and GF in three dimensions using human samples. Thus, the present study aimed to investigate the association between mandibular condyle and GF in normal and abnormal facial profile patients using CBCT.
MATERIALS AND METHODS
This retrospective, cross-sectional, comparative study was conducted at the College of Dentistry, Jazan University, and approved by the Scientific Research Ethics Committee, College of Dentistry, Jazan University (reference no.: CODJU-18061).
Sample
The sample size was calculated using the G*Power 3.0.10 software. The mean and standard deviation (SD) of Cl I and Cl II sagittal surface area measurements [29.82 (7.78) and 40.96 (15.6 mm2), respectively] from Alhammadi et al.20 were used to calculate the necessary sample size. Adopting a two-sided confidence level of 95%, power of 90%, and a ratio of 1:1 for the patients with normal and abnormal facial profiles indicated that the minimum required sample for each group was 27 subjects.
Seventy female subjects (140 TMJs) were selected from the CBCT database of the institute for this study between November 2018 and May 2019. The sample was divided into two groups according to the facial profile. Group I: 35 subjects with normal facial profiles (GI: NFP) in which the soft tissue glabella, subnasal point, and the soft tissue chin are almost in the same straight line; and group II: 35 subjects with abnormal facial profiles (GII: AFP) in which the same imaginary line is either convex or concave indicating variation from standard norms. Subjects displaying a convex or concave line were considered an abnormal facial profile and included in the study sample. Subjects were included in the present study if they fulfilled the following criteria: (1) aged between 18 and 25 years; (2) at least 20 remaining teeth with occlusal posterior stopper; (3) no history or signs of TMDs; (4) no history of serious disease, trauma, or operation in the craniofacial region; (5) no history of TMJ surgery and/or trauma; (6) no history of systemic diseases that could affect bone such as rheumatoid arthritis; (7) no history of medications that may affect the TMJ; and (8) no history of growth abnormalities. Additionally, all selected subjects had high-quality CBCT images. The selected sample was checked for the fulfillment of all criteria using the CBCT images and the R4 database, which contains the medical history, clinical examination results, and treatment procedures performed for all patients from the institute’s outpatient clinics.
CBCT Examination and Analysis
All subjects were scanned using the 3D Accuitomo 170 (MORITA, Japan) using the same parameters: field of view 170 × 120 mm, 90 kV, 5–8 mA, 17.5 second exposure time, and voxel size 0.25 mm. The DICOM files from all subjects were reviewed using the Invivo Dental software, version 5.02 (Anatomage, San Jose, CA, USA). One oral and maxillofacial radiologist with 12 years of professional experience evaluated the CBCT images. Before starting the image analysis, intraexaminer reliability was conducted on 20 TMJs with a 2-week interval between the first and second analyzes. To determine the interexaminer reliability, an orthodontist with 10 years of professional experience in CBCT-based TMJ measurement evaluated 20 images and the results from both examiners were compared.
The image analysis was adopted from the 3-D analysis described by Alhammadi et al.20,24 and involved digitizing the different anatomical landmarks included in the analysis on the 3-D volume using slice allocators on the 2-D planes (sagittal, coronal, and axial) (Table 1 and Fig. 1). Three reference planes were used to take the positional measurements:
- Horizontal plane (HP): extends from the right orbital and porion to the left porion.
- Midsagittal plane (MSP): extends through the sella and nasion, perpendicular to the horizontal plane.
- Vertical plane (VP): extends through the sella, perpendicular to both the horizontal and midsagittal planes.
The following positional measurements were acquired; these measurements were selected as they provide 3-D comprehensive evaluations about the exact position of GF and mandibular condyles, which are affected by growth determinants in the craniofacial region:
- Glenoid fossa vertical (GFV) position: The perpendicular distance from the GF to the HP.
- Glenoid fossa anteroposterior position (GFAP): The perpendicular distance from GF to the VP.
- Glenoid fossa mediolateral position (GFML): The perpendicular distance from GF to the MSP.
- Mandibular condyle vertical (CV) position: The perpendicular distance from the superior condylar point to the HP.
- Mandibular condyle anteroposterior position (CAP): The perpendicular distance from the most anterior condylar point to the VP.
- Mandibular condyle mediolateral position (CML): The perpendicular distance from the most medial condylar point to the MSP.
- Vertical condylar joint position (VCJP): The difference between the condylar and the mandibular fossa heights in reference to the tuberculo-meatal (TM) line.
- Anteroposterior condylar joint position (APCJP): The anteroposterior condylar position inside the joint, determined using Pullinger and Hollender’s formula.25
The following dimensional measurements were recorded; these measurements were selected as they provide 3-D comprehensive evaluations about the exact dimensions of GF and mandibular condyles in the three planes, height, width, and length as well as surface area, which are changeable dimensions during craniofacial growth:
- Glenoid fossa height (GFH): The perpendicular distance between the GF and the TM line.
- Glenoid fossa width (GFW): Linear distance between the most anterior and posterior points of the GF.
- Glenoid fossa surface area (GFSA): The total surface area bound by the anterior, superior, and posterior walls and the TM line.
- Mandibular condyle length (CL): Linear distance between the most medial and lateral condylar points.
- Mandibular condyle width (CW): Linear distance between the most anterior and posterior condylar points.
- Mandibular condyle height (CH): Linear distance between the most superior condylar point and the TM line.
- Axial condylar surface area (ACSA): The total surface area of the widest condyle in the axial section.
- Sagittal condylar surface area (SCSA): The total surface area of the largest condyle in the sagittal section bound by the TM line.
- Coronal condylar surface area (CCSA): The total surface area of the largest condyle in the coronal section bound inferiorly by the narrowest horizontal line of the condyle.
| No | Landmark | Definition |
|---|---|---|
| 1 | Nasion | Nasofrontal structure in the midline |
| 2 | Sella | Center of the sella turcica in the middle cranial fossa |
| 3 | Right/left orbitale | The most inferior point on the right or left infraorbital rim |
| 4 | Left porion | The most outer and superior bony point of the left external auditory meatus |
| 5 | Right/left gonion | The midpoint on the right or left angle of the mandible, halfway between the corpus and ramus |
| 6 | Soft tissue glenoid fossa | The most superior and midpoint of the soft tissue right or left glenoid fossa region |
| 7 | Bony glenoid fossa | The most superior and midpoint of the bony right or left glenoid fossa |
| 8 | Superior condylar point | The most superior point of the right or left condylar head |
| 9 | Lateral condylar point | The most lateral point of the right or left condylar head |
| 10 | Medial condylar point | The most medial point of the right or left condylar head |
| 11 | Anterior condylar point | The most anterior point of the right or left condylar head |
| 12 | Posterior condylar point | The most posterior point of the right or left condylar head |
| 13 | Articular tubercle | The most inferior and posterior point of right or left articular tubercle |
| 14 | Inferior meatus | The most inferior and lateral point of right or left external auditory meatus |
| 15 | Anterior fossa point | The most anterior and inferior point in the right or left anterior wall of the glenoid fossa |
| 16 | Posterior fossa point | The most posterior and inferior point in the right or left posterior wall of the glenoid fossa opposed to inferior meatus point |
| 17 | Anterior condylar neck point | The deepest anterior point of right or left mandibular condylar neck corresponding to the area of maximum width |
| 18 | Posterior condylar neck point | The most posterior point of right or left mandibular condylar neck corresponding to the area of maximum width |
| 19 | Anterior joint space “fossa point” | The most posterior point of the right or left anterior wall of the glenoid fossa opposed to the shortest anterior condylar-fossa distance |
| 20 | Anterior joint space “condylar point” | The most anterior point of the right or left condyle opposed to the shortest anterior condylar-fossa distance |
| 21 | Posterior joint space “fossa point” | The most anterior point of the right or left posterior wall of the glenoid fossa opposed to the shortest posterior condylar-fossa distance |
| 22 | Posterior joint space “ condylar point” | The most posterior point of the right or left condyle opposed to the shortest posterior condylar-fossa distance |
Statistical Analysis
The raw data were imported into SPSS for Windows, version 20 (IBM, Armonk, NY, USA). The data were presented as mean and SD for each group. An independent t-test was used to compare the two groups (i.e., NFP vs. AFP). Significant positional and dimensional associations between the measurements of the condyle and GF were identified using the Pearson’s correlation coefficient test. The inter- and intraexaminer reliabilities were assessed using the interclass correlation coefficient (ICC) test. A p value below 0.05 was considered statistically significant.
RESULTS
A total of 70 female subjects (35 NFP and 35 AFP) were included in the present study with a comparable mean age of 21.4 ± 2.2 and 21.8 ± 2.3 years for GI and GII, respectively. Inter- and intraexaminer reliabilities ranged between 0.8753 (0.7039–0.8902) for CH and 0.9243 (0.7078–0.9720) for GFW. Descriptive statistics for both groups are presented as means and SDs in Table 2; these revealed statistically significant differences between GI and GII in both right and left of the GFV (p = 0.003, p < 0.0001, respectively) parameter. The positional and dimensional parameters of the condyle were also significantly different between GI and GII in the right and left CV, VCJP, CH, ACSA, and SCSA parameters with p values of 0.002 and <0.0001, 0.001 and <0.0001, <0.0001 and <0.0001, 0.036 and 0.007, and <0.0001 and 0.001, respectively.
Table 3 presents the dimensional associations on the right side of the NFP and AFP groups, which include positive associations between SCSA and all dimensional parameters of GF with p values from 0.000 to 0.044 for both groups, while GFW showed positive associations with CW and ACSA (p = 0.000 and 0.019 and 0.004 and 0.028 in the NFP and AFP groups, respectively). On the other hand, CW was negatively associated with GFSA (p = 0.008) and a positive association was detected between CCSA and GFH (p = 0.041) only in the AFP group, while CH was positively associated with GFW (p = 0.019) only in the NFP group.
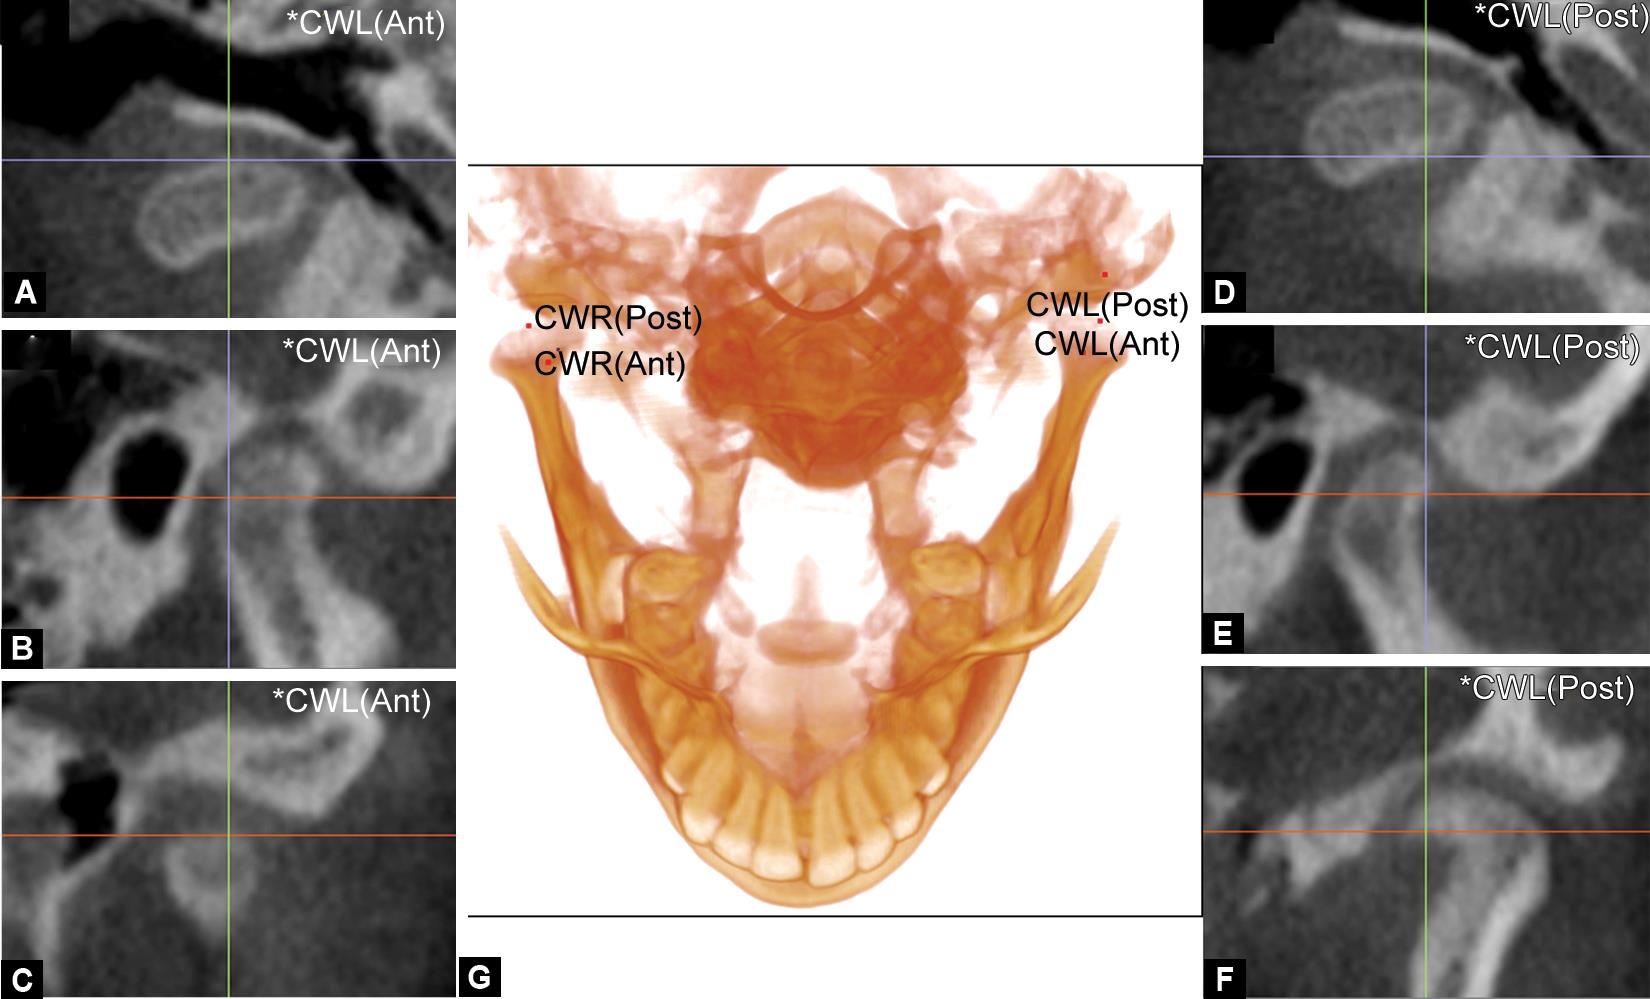
Figs 1A to G: Digitization of condylar width landmarks on the 3-D volume with the adjustment on the slice locator multiplanar images. The demonstration of the most anterior point of the condyle in (A) axial, (B) sagittal, and (C) coronal planes and the most posterior point of the condyle in (D) axial, (E) sagittal, and (F) coronal planes are represented. The digitization of the most anterior and posterior points of the condyle (G) on the 3D volume is also represented
Positional associations from the right side of both groups are displayed in Table 4. Some variables showed significant associations in both groups: CV with VCJP (p = 0.000 and 0.014 for the NFP and AFP groups, respectively), CAP with GFV and GFAP (p values range from 0.000 to 0.024) and CML with GFML (p = 0.009 and 0.000 for the NFP and AFP groups, respectively), while other parameters demonstrated association only in one group: CV with GFML and APCJP (p = 0.015 and 0.001, respectively) and CAP with GFML (p = 0.019) in the NFP group only and CV with GFV and GFAP (p = 0.002 and 0.016, respectively) in the AFP group only.
As presented in Table 5, dimensional measurements from the left side revealed positive associations between SCSA and all GF parameters in both groups with p values ranging from 0.000 to 0.011. Additionally, positive associations were detected in both the NFP and AFP groups between CCSA and GFH (p = 0.000 and 0.003, respectively). However, other parameters only correlated significantly in one group, such as the negative associations between CW and GFH and GFSA (p = 0.004 and 0.000, respectively) and the positive associations between CH and GFH and GFSA (p = 0.002 and 0.034, respectively) in the AFP group only.
Upon positional association of left side, positive associations were revealed between CAP and GFAP (p = 0.012 and 0.000 in the NFP and AFP groups, respectively) and between CML and GFML (p value of 0.000). In contrast, negative associations were detected between VC and GFV (p = 0.000), CAP and GFV (0.006), and CML and GFAP (0.003) in the AFP group only, while negative associations were found between CAP and GFML (p = 0.013) and CML and GFV (p = 0.005) in the NFP group only (Table 6).
This comprehensive analysis revealed strong associations between the mandibular condyle and GF in most dimensional (height, width, length, and surface areas) and positional measurements (in anteroposterior, vertical, and mediolateral positions) of both patient groups, which might indicate mutual effect during craniofacial growth.
DISCUSSION
The TMJ and its associated structures are one of the most anatomical complex regions in the craniofacial area. Its complexity arises from being formed of two main parts, the mandibular or GF, which is a part of the cranial base, and the mandibular condyle, which is a part of the mandible. Each of these components has its distinct pattern of growth and development during the intrauterine and postuterine periods and especially during pubertal growth spurts. From animal studies, the early formation of the mandibular fossa is initiated by external factors other than the mandibular condyle but the continued growth of the mandibular fossa depends on the presence of the mandibular condyle.21,22 This underlies the strong association between the growth of the GF and that of the mandibular condyle. Thus, investigations into the associations between their dimensional and positional properties in adults contribute to understanding TMJ morphology. Therefore, the present study aimed to identify dimensional and positional associations between the GF and the mandibular condyle in a sample of adult humans with NFP and AFP. Only females were selected in the current study to avoid the gender confounding factor as the craniofacial growth is a gender-based physiological process in which both genders differ in timing, intensity, and duration of the skeletal growth.26 This analysis revealed strong associations between the mandibular condyle and GF in most dimensional and positional measurements of both patient groups with the highest association detected between SCSA and all GF parameters.
| Variables | Right side | Left side | ||||||||
|---|---|---|---|---|---|---|---|---|---|---|
| GI: NFP | GII: AFP | p value* | GI: NFP | GII: AFP | p value* | |||||
| Mean | SD | Mean | SD | Mean | SD | Mean | SD | |||
| Positional glenoid fossa parameters | ||||||||||
| Vertical position | 1.30 | 0.81 | 2.16 | 1.39 | 0.003 | −0.3 | 1.56 | 2.17 | 1.67 | <0.0001 |
| Anteroposterior position | 11.29 | 3.62 | 10.26 | 3.15 | 0.202 | 8.80 | 2.91 | 10.86 | 3.99 | 0.016 |
| Mediolateral position | 45.64 | 2.49 | 46.64 | 2.58 | 0.104 | 46.37 | 2.86 | 46.06 | 2.27 | 0.617 |
| Dimensional glenoid fossa parameters | ||||||||||
| GFH | 8.32 | 1.03 | 8.51 | .84 | 0.401 | 8.32 | 0.977 | 8.45 | 1.22 | 0.623 |
| GFW | 15.98 | 1.76 | 18.19 | 2.54 | <0.0001 | 17.2 | 1.94154 | 18.05 | 2.33 | 0.099 |
| GFSA | 85.12 | 17.47 | 96 | 22.99 | 0.029 | 89.25 | 21.41 | 104.79 | 27.1 | 0.01 |
| Positional mandibular condyle parameters | ||||||||||
| Vertical condyle position | 3.63 | 1.67 | 2.41 | 1.55 | 0.002 | 3.75 | 1.56 | 2.28 | 1.46 | <0.0001 |
| Anteroposterior condyle position | 6.69 | 2.73 | 4.81 | 3.18 | 0.01 | 5.08 | 1.91 | 5.92 | 3.78 | 0.246 |
| Mediolateral condyle position | 38.61 | 2.159 | 39.55 | 3.03 | 0.138 | 39.14 | 2.11 | 39.33 | 3.3 | 0.775 |
| Vertical joint position | 3.54 | 1.03 | 2.64 | 1.21 | 0.001 | 3.64 | 0.38 | 2.63 | 1.29 | <0.0001 |
| Anteroposterior joint position | 12.24 | 20.04 | 10.53 | 32.57 | 0.792 | 10.87 | 13.33 | 6.76 | 24.09 | 0.382 |
| Dimensional mandibular condyle parameters | ||||||||||
| Mandibular CH | 8.99 | 1.07 | 11.36 | 1.57 | <0.0001 | 8.77 | 1.02 | 10.75 | 1.59 | <0.0001 |
| Mandibular CW | 7.62 | 1.33 | 7 | 1.24 | 0.049 | 7.24 | 1.27 | 6.91 | 1.47 | 0.311 |
| Mandibular CL | 18.48 | 1.88 | 17.66 | 2.25 | 0.099 | 19.13 | 1.31 | 17.65 | 2.28 | 0.002 |
| ACSA | 112.96 | 20.11 | 102.77 | 19.86 | 0.036 | 114.80 | 20.78 | 100.19 | 23.24 | 0.007 |
| SCSA | 28.87 | 7.64 | 39.33 | 14.67 | <0.0001 | 30.99 | 7.67 | 39.09 | 11.53 | 0.001 |
| CCSA | 71.91 | 11.18 | 75.22 | 23.35 | 0.453 | 72.91 | 8.54 | 80.1 | 21.88 | 0.077 |
* Independent t-test Bold values specify the significant values
| Variables | GI: NFP | GII: AFP | |||||
|---|---|---|---|---|---|---|---|
| GFH | GFW | GFSA | GFH | GFW | GFSA | ||
| Mandibular CL | Pearson correlation | −0.187 | −0.319 | −0.323 | 0.224 | −0.127 | 0.025 |
| Sig. (two-tailed) | 0.282 | 0.062 | 0.058 | 0.195 | 0.467 | 0.885 | |
| Mandibular CW | Pearson correlation | 0.078 | 0.645** | 0.320 | −0.147 | 0.396* | −0.441** |
| Sig. (two-tailed) | 0.655 | 0.000 | 0.061 | 0.398 | 0.019 | 0.008 | |
| Mandibular CH | Pearson correlation | −0.290 | 0.393* | 0.032 | 0.221 | 0.258 | −0.006 |
| Sig. (two-tailed) | 0.091 | 0.019 | 0.856 | 0.201 | 0.135 | 0.974 | |
| ACSA | Pearson correlation | 0.017 | 0.475** | 0.072 | 0.165 | 0.370* | −0.210 |
| Sig. (two-tailed) | 0.925 | 0.004 | 0.682 | 0.344 | 0.028 | 0.226 | |
| SCSA | Pearson correlation | 0.360* | 0.565** | 0.872** | 0.343* | 0.437** | 0.732** |
| Sig. (two-tailed) | 0.034 | 0.000 | 0.000 | 0.044 | 0.009 | 0.000 | |
| CCSA | Pearson correlation | −0.091 | −0.128 | −0.188 | 0.348* | 0.202 | 0.141 |
| Sig. (two-tailed) | 0.602 | 0.464 | 0.280 | 0.041 | 0.244 | 0.420 | |
Bold values specify the significant values
* Correlation is significant at the 0.05 level (2-tailed)
** Correlation is significant at the 0.01 level (2-tailed)
| Variables | GI: NFP | GII: AFP | |||||||||
|---|---|---|---|---|---|---|---|---|---|---|---|
| Glenoid foss position | Mandibular condyle joint position | Glenoid foss position | Mandibular condyle joint position | ||||||||
| V | AP | ML | V | AP | V | AP | ML | V | AP | ||
| Vertical condylar position | Pearson correlation | 0.141 | 0.220 | 0.407* | 0.567** | 0.541** | −0.501** | 0.406* | 0.191 | 0.413* | 0.285 |
| Sig. (two-tailed) | 0.419 | 0.205 | 0.015 | 0.000 | 0.001 | 0.002 | 0.016 | 0.271 | 0.014 | 0.097 | |
| Anteroposterior condylar position | Pearson correlation | 0.464** | 0.817** | 0.396* | 0.014 | 0.009 | −0.382* | 0.886** | −0.235 | −0.044 | 0.184 |
| Sig. (two-tailed) | 0.005 | 0.000 | 0.019 | 0.935 | 0.959 | 0.024 | 0.000 | 0.174 | 0.802 | 0.290 | |
| Mediolateral condylar position | Pearson correlation | 0.212 | −0.068 | 0.508** | 0.437** | −0.272 | −0.255 | −0.290 | 0.678** | 0.123 | 0.118 |
| Sig. (two-tailed) | 0.222 | 0.700 | 0.002 | 0.009 | 0.114 | 0.140 | 0.091 | 0.000 | 0.483 | 0.498 | |
V, vertical; AP, anteroposterior; ML, mediolateral
Bold values specify the significant values
* Correlation is significant at the 0.05 level (2-tailed)
** Correlation is significant at the 0.01 level (2-tailed)
The side-based characteristics of the GF and the mandibular condyle tended to differ significantly between the two groups except for the mediolateral fossa and condylar positions, GFH, CCSA, and the anteroposterior joint condylar position. These findings are consistent with Alhammadi et al.20 who reported significant differences between normal (skeletal class I) and abnormal (skeletal class II and III) groups in GFW, GFSA, and all condylar dimensions. Moreover, a study conducted on different vertical facial patterns found significant differences between the average, short, and long face groups in two-dimensional parameters of the GF (GFW and GFSA) and most of the dimensional and positional parameters of the mandibular condyle.19 These differences are likely explained by the distinct pattern of craniofacial growth in the three types of skeletons, more horizontal growth in class III and more vertical growth in class II relative to class I skeletons.
For clarity’s sake, the significant associations between the GF and mandibular condyle were categorized into highly common associations that occurred in both the NFP and AFP groups, the common associations reported on both sides of the same group (either the NFP or AFP), and uncommon associations found on one side of the four studied sides of both groups. There were highly common dimensional associations between the most representative surface area of the condyle (SCSA) with all the dimensional parameters of the GF (GFH, GFW, GFSA). Another highly common association was identified between the CW and GFW and between ACSA and CCSA with GFH and GFW, respectively. Taken together, these findings indicate that the dimensions of the GF are highly related to those of the condyle. As such, the growth of the GF in a downward and forward direction following cranial base growth affects the dimensions of the mandibular condyles; at the same time, the upward and backward growth of the condylar cartilage also likely plays a role in the dimensional changes of the GF.
| Variables | GI: NFP | GII: AFP | |||||
|---|---|---|---|---|---|---|---|
| GFH | GFW | GFSA | GFH | GFW | GFSA | ||
| Mandibular CL | Pearson correlation | 0.555** | 0.020 | 0.121 | −0.025 | −0.489** | −0.310 |
| Sig. (two-tailed) | 0.001 | 0.909 | 0.490 | 0.887 | 0.003 | 0.070 | |
| Mandibular CW | Pearson correlation | −0.141 | 0.387* | −0.119 | −0.478** | −0.044 | −0.598** |
| Sig. (two-tailed) | 0.420 | 0.022 | 0.497 | 0.004 | 0.800 | 0.000 | |
| Mandibular CH | Pearson correlation | −0.054 | −0.111 | −0.221 | 0.497** | −0.018 | 0.360* |
| Sig. (two-tailed) | 0.759 | 0.525 | 0.202 | 0.002 | 0.916 | 0.034 | |
| ACSA | Pearson correlation | −0.268 | 0.397* | −0.188 | −0.310 | −0.026 | −0.477** |
| Sig. (two-tailed) | 0.120 | 0.018 | 0.279 | 0.070 | 0.882 | 0.004 | |
| SCSA | Pearson correlation | 0.424* | 0.434** | 0.895** | 0.603** | 0.427* | 0.687** |
| Sig. (two-tailed) | 0.011 | 0.009 | 0.000 | 0.000 | 0.010 | 0.000 | |
| CCSA | Pearson correlation | 0.661** | 0.472** | 0.551** | 0.363* | −0.093 | 0.058 |
| Sig. (two-tailed) | 0.000 | 0.004 | 0.001 | 0.032 | 0.594 | 0.740 | |
Bold values specify the significant values
* Correlation is significant at the 0.05 level (2-tailed)
** Correlation is significant at the 0.01 level (2-tailed)
| Variables | GI: NFP | GII: AFP | |||||||||
|---|---|---|---|---|---|---|---|---|---|---|---|
| Glenoid foss position | Mandibular condyle joint position | Glenoid foss position | Mandibular condyle joint position | ||||||||
| V | AP | ML | V | AP | V | AP | ML | V | AP | ||
| Vertical condylar position | Pearson correlation | 0.057 | −0.170 | 0.263 | 0.315 | 0.197 | −0.744** | 0.268 | 0.173 | 0.413* | 0.085 |
| Sig. (two-tailed) | 0.747 | 0.330 | 0.127 | 0.066 | 0.258 | 0.000 | 0.120 | 0.319 | 0.014 | 0.629 | |
| Anteroposterior condylar position | Pearson correlation | −0.100 | 0.419* | −0.416* | −0.401* | 0.003 | −0.457** | 0.767** | −0.300 | −0.069 | −0.092 |
| Sig. (two-tailed) | 0.569 | 0.012 | 0.013 | 0.017 | 0.985 | 0.006 | 0.000 | 0.080 | 0.692 | 0.599 | |
| Mediolateral condylar position | Pearson correlation | −0.468** | −0.191 | 0.645** | 0.359* | 0.030 | −0.053 | −0.486** | 0.719** | −0.142 | 0.178 |
| Sig. (two-tailed) | 0.005 | 0.271 | 0.000 | 0.034 | 0.866 | 0.760 | 0.003 | 0.000 | 0.417 | 0.306 | |
V, vertical; AP, anteroposterior; ML, mediolateral
Bold values specify the significant values
* Correlation is significant at the 0.05 level (2-tailed)
** Correlation is significant at the 0.01 level (2-tailed)
Although this detailed dimensional association was not addressed before, other studies have reported similar findings. Ribeiro et al.15 assessed the geometry of the mandibular condyle and GF from different views and found that the distribution of condyle and fossa shapes favored a rounded shape in the lateral (57 and 66%, respectively) and posterior (53 and 83%, respectively) views. These geometry findings suggest strong and moderate associations between the lateral and posterior views, respectively. Although significant differences were detected between the NFP and AFP groups in most of the parameters, the positional and dimensional relationship between the mandibular condyle and GF could be ascribed to their strong association during growth periods, reflected in their positional and dimensional relativity.
Regarding positional associations, it was found between GFAP and GFML with its corresponding positions of the mandibular condyles and between the CAP and GFV within the craniofacial complex. This is potentially dictated by the direction of condylar growth, which grows downward, forward, and laterally resulting in increased vertical rami height and intercondylar distance.27 Subsequently, the GF follows the direction of these growth patterns, thus maintaining its 3-D relationship to the condylar fossa.
A common dimensional association was found between the CW and the GFSA and another positional association between the CV and GFV. Ejima et al.17 found a significant correlation between the GF’s roof thickness and sagittal condylar morphology. The association between the vertical condylar and GF positions was mostly due to the vertical load distribution during typical function, as reported by Tsuruta et al.28 and Maeda et al.29 who analyzed factors influencing stress distribution in the condyle region, and observed that morphological changes in the condylar head and the roof of the GF altered the stress distribution. Moreover, associations among these parameters were detected either in the NFP or AFP group, which might be due to the effect of different growth patterns on each group on the measured parameters.
In addition to its strengths, the present study also has some limitations. Despite being calculated in advance, the sample size should be larger with more subgrouping based on the anteroposterior (convex or concave) and vertical growth pattern (vertical or horizontal) in any future research. Another limitation is the cross-sectional study design; future studies should be longitudinal to enable determining whether the associations identified in the present study are maintained through different developmental stages and how these can be used to provide proper patient care decisions.
CONCLUSION
Based on the result of this study, it could be concluded that a great association between mandibular condyle and GF in both positional and dimensional measurements was found in the NFP and AFP groups with the highest association being between SCSA and all dimensional GF parameters. Further studies are warranted that take into consideration the limitations of the current study.
ETHICS
Ethical approval was obtained for this internship project from the Scientific Research Committee of the College of Dentistry, Jazan University (Reference No.: CODJU-18061).
ACKNOWLEDGMENT
I am very thankful to Dr Maged S. Alhammadi for his help with the interexaminer reliability assessment.
REFERENCES
1. Moon H-J, Lee Y-K. The relationship between dental occlusion/temporomandibular joint status and general body health: part 1. Dental occlusion and TMJ status exert an influence on general body health. J Alternat Complement Med 2011;17(11):995–1000. DOI: 10.1089/acm.2010.0739.
2. Okeson JP. Evolution of occlusion and temporomandibular disorder in orthodontics: past, present, and future. Am J Orthod Dentofacial Orthop 2015;147(5):S216–S223. DOI: 10.1016/j.ajodo.2015.02.007.
3. Warreth A, Fundamentals of occlusion and restorative dentistry. Part II: occlusal contacts, interferences and occlusal considerations in implant patients. 2015.
4. Kaur A, Natt AS, Mehra SK, et al. Improved visualization and assessment of condylar position in the glenoid fossa for different occlusions: a CBCT study. J Contempor Dent Pract 2016;17(8):679. DOI: 10.5005/jp-journals-10024-1912.
5. Bordoni B, Varacallo M. Anatomy, head and neck, temporomandibular joint. StatPearls [Internet]. StatPearls Publishing; 2019.
6. Derwich M, Mitus-Kenig M, Pawlowska E. Temporomandibular joints’ morphology and osteoarthritic changes in cone-beam computed tomography images in patients with and without reciprocal clicking—A case control study. Int J Environ Res Public Health 2020;17(10):3428. DOI: 10.3390/ijerph17103428.
7. Larheim T, Abrahamsson A, Kristensen M, et al. Temporomandibular joint diagnostics using CBCT. Dentomaxillofac Radiol 2015;44(1):20140235. DOI: 10.1259/dmfr.20140235.
8. Talmaceanu D, Lenghel LM, Bolog N, et al. Imaging modalities for temporomandibular joint disorders: an update. Clujul Med 2018;91(3):280.
9. Ferreira LA, Grossmann E, Januzzi E, et al. Diagnosis of temporomandibular joint disorders: indication of imaging exams. Brazilian J Otorhinolaryngol 2016;82(3):341–352. DOI: 10.1016/j.bjorl.2015.06.010.
10. Schnabl D, Rottler A-K, Schupp W, et al. CBCT and MRT imaging in patients clinically diagnosed with temporomandibular joint arthralgia. Heliyon 2018;4(6):e00641. DOI: 10.1016/j.heliyon.2018.e00641.
11. Almashraqi AA, Ahmed EA, Mohamed NS, et al. Evaluation of different low-dose multidetector CT and cone beam CT protocols in maxillary sinus imaging: part I—an in vitro study. Dentomaxillofac Radiol 2017;46(6):20160323. DOI: 10.1259/dmfr.20160323.
12. Mathew AL, Sholapurkar AA, Pai KM. Condylar changes and its association with age, TMD, and dentition status: a cross-sectional study. Int J Dent 2011;2011:413639.
13. Al-koshab M, Nambiar P, John J. Assessment of condyle and glenoid fossa morphology using CBCT in South-East Asians. PLoS ONE 2015;10(3):e0121682. DOI: 10.1371/journal.pone.0121682.
14. Obamiyi S, Malik S, Wang Z, et al. Radiographic features associated with temporomandibular joint disorders among African, white, Chinese, hispanic, and Indian racial groups. Niger J Clin Pract 2018;21(11):1495–1500.
15. Ribeiro EC, Sanches ML, Alonso LG, et al. Shape and symmetry of human condyle and mandibular fossa. Int J Odontostomat 2015;9(1):65–72. DOI: 10.4067/S0718-381X2015000100010.
16. Serindere G, Belgin CA, Serindere M. Volumetric and morphological analysis of condyle and glenoid fossa on computed tomography. Eur Arch Otorhinolaryngol 2020(9). DOI: 10.1007/s00405-020-06078-5.
17. Ejima K, Schulze D, Stippig A, et al. Relationship between the thickness of the roof of glenoid fossa, condyle morphology and remaining teeth in asymptomatic European patients based on cone beam CT data sets. Dentomaxillofac Radiol 2013;42(3):90929410. DOI: 10.1259/dmfr/90929410.
18. İlgüy D, İlgüy M, Fişekçioğlu E, et al. Articular eminence inclination, height, and condyle morphology on cone beam computed tomography. Sci World J 2014;2014:761714. DOI: 10.1155/2014/761714.
19. Alhammadi MS, Fayed MMS, Labib A. Comprehensive three-dimensional cone beam computed tomography analysis of the temporomandibular joint in different vertical skeletal facial patterns. J World Federat Orthodont 2016;5(1):9–17. DOI: 10.1016/j.ejwf.2016.02.001.
20. Alhammadi MS, Fayed MS, Labib A. Three-dimensional assessment of temporomandibular joints in skeletal class I, class II, and class III malocclusions: cone beam computed tomography analysis. J World Federat Orthodont 2016;5(3):80–86. DOI: 10.1016/j.ejwf.2016.07.001.
21. Campos M, Cruz A. Morphometric study of the mandibular condyle of the rat during postnatal development. Cells Tissues Organs 1985;123(3):189–194. DOI: 10.1159/000146061.
22. Wang Y, Liu C, Rohr J, et al. Tissue interaction is required for glenoid fossa development during temporomandibular joint formation. Dev Dyn 2011;240(11):2466–2473. DOI: 10.1002/dvdy.22748.
23. Kikuchi K, Takeuchi S, Tanaka E, et al. Association between condylar position, joint morphology and craniofacial morphology in orthodontic patients without temporomandibular joint disorders. J Oral Rehabil 2003;30(11):1070–1075. DOI: 10.1046/j.1365-2842.2003.01194.x.
24. Alhammadi M, Fayed M, Labib A. Three-dimensional assessment of condylar position and joint spaces after maxillary first premolar extraction in skeletal class II malocclusion. Orthod Craniofac Res 2017;20(2):71–78. DOI: 10.1111/ocr.12141.
25. Pullinger AG, Solberg WK, Hollender L, et al. Relationship of mandibular condylar position to dental occlusion factors in an asymptomatic population. Am J Orthod Dentofacial Orthop 1987;91(3):200–206. DOI: 10.1016/0889-5406(87)90447-1.
26. Avci S, Ergun T, Aydin E, et al. Sex differences in adult craniofacial parameters. Surg Radiol Anat 2015;37(9):1069–1078. DOI: 10.1007/s00276-015-1477-9.
27. Buschang PH, Jacob HB, Mandibular rotation revisited: what makes it so important? Paper presented at: Seminars in Orthodontics 2014.
28. Tsuruta A, Yamada K, Hanada K, et al. Thickness of the roof of the glenoid fossa and condylar bone change: a CT study. Dentomaxillofac Radiol 2003;32(4):217–221. DOI: 10.1259/dmfr/15476586.
29. Maeda Y. Biomechanical simulation of the morphological change in the temporomandibular joint part 1: factors influencing stress distribution. J Jpn Soc TMJ 1991;3:1–9.
________________________
© The Author(s). 2020 Open Access This article is distributed under the terms of the Creative Commons Attribution 4.0 International License (https://creativecommons.org/licenses/by-nc/4.0/), which permits unrestricted use, distribution, and non-commercial reproduction in any medium, provided you give appropriate credit to the original author(s) and the source, provide a link to the Creative Commons license, and indicate if changes were made. The Creative Commons Public Domain Dedication waiver (http://creativecommons.org/publicdomain/zero/1.0/) applies to the data made available in this article, unless otherwise stated.