ORIGINAL RESEARCH |
https://doi.org/10.5005/jp-journals-10024-3118 |
Comparative Evaluation of Implant Stability, Insertion Torque, and Implant Macrogeometry in Different Bone Densities Using Resonance Frequency Analysis
1Department of Prosthodontics, Sharavathi Dental College and Hospital, Shivamogga, Karnataka, India
2Department of Dentistry, ESICMC PGIMSR Medical College, Bengaluru, Karnataka, India
3Department of Prosthodontics, Al-Azhar Dental College, Thodupuzha, Kerala, India
4Department of Orthodontics, Former Consultant, Max Hospital, Gurugram, Haryana, India
5Department of Oral Medicine and Radiology, Adesh Institute of Dental Sciences and Research, Bathinda, Punjab, India
6Dr Dang’s Multispecialty Dental Clinic and Implant Centre, New Delhi, India
Corresponding Author: Kamala Rajendra, Department of Dentistry, ESICMC PGIMSR Medical College, Bengaluru, Karnataka, India, Phone: +91 9447612454, e-mail: drkamala81@gmail.com
How to cite this article: Haseeb SA, Rajendra K, Manual L, et al. Comparative Evaluation of Implant Stability, Insertion Torque, and Macrogeometry in Different Bone Densities Using Resonance Frequency Analysis. J Contemp Dent Pract 2021;22(6):665–668.
Source of support: Nil
Conflict of interest: None
ABSTRACT
Aim and objective: Evaluation and comparison of insertion torque (IT) and the implant stability of two different implant macrogeometry in different bone densities using resonance frequency analysis.
Materials and methods: A total of 48 implants (with two implant types having regular and novel macrogeometry) were classified into 4 groups with 12 samples in each group. Group A regular implant without surface treatment, group B regular implant with surface treating, group C novel implant deprived of surface treating, and group D was new dental implant with surface treatment were used. Implant stability quotient (ISQ), implant IT, removal torque (RT) percentage, and torque reduction percentage were calculated.
Results: The mean ± SD ISQ value of bone 1 in group A was 56.7 ± 3.2, in group B was 58.6 ± 2.4, in group C was 57.1 ± 3.5, and in group D was 59.3 ± 2.9. In bone 2, the value was 57.8 ± 1.4, 59.5 ± 1.5, 58.2 ± 2.6, and 59.5 ± 2.4 among A, B, C, and D groups correspondingly. In bone 3, it was 59.4 ± 2.4, 60.3 ± 2.3, 60.4 ± 2.8, and 62.7 ± 2.5 among A, B, C, and D groups correspondingly. In bone 4, it was 67.2 ± 3.4, 69.5 ± 2.7, 68.7 ± 2.4, and 69.4 ± 2.3 among A, B, C, and D groups correspondingly. There was a substantial difference in IT and nonsignificant difference in RT in different groups.
Conclusion: There was a low IT value with new implant macrogeometry as compared to regular implant macrogeometry. There was absence of association between IT and implant stability.
Clinical significance: Calculation of torque insertion score helps in implant placement. Higher bone density scores produce a higher option of decreasing the initial torque. Low IT of new implant types is useful to reduce failure.
Keywords: Bone density, Implant, Surface treating, Torque.
INTRODUCTION
Dental implants are commonly used for the replacement of missing teeth. During the initial stage of healing after dental implant placement, it should be secured from unfavorable micromovements. As per the literature, this micromovement influences the osseointegration process. When micromovement exceeds threshold values of 50 and 150 µm, there is a higher chance of colonization of fibroblasts at the bone–implant interface, thus causing implant failure. In such conditions, the role of initial dental implant stability is important for a better outcome. These data of implant stability are useful in evaluating the time period required for complete healing around implant. This ensures treatment safety and decreases the overall treatment period. Various noninvasive techniques have been suggested to assess the implant stability, such as dental fine tester, periotest and implatest conventional impulse test, and resonance frequency analysis (RFA) and implant insertion torque (IT) measurements.1
Implant stability is used to measure the absence of clinical mobility of an implant, which is necessary for osseointegration. It can be attained by primary and secondary stabilities. The primary implant stability at the time of surgery is regulated by the surgical technique, bone density, and implant design. Secondary stability is based on bone development and remodeling at the implant–bone boundary and is prejudiced by the wound healing period. It has been stated that resonance frequency analysis (RFA) is a clinically valid and dependable technique to measure implant stability.2
It is evident that implant-related factors, such as implant design, surface roughness, and patient-related factors, such as quantity and quality of bone, fit in patients’ bone, and design of osteotomy, contribute to the success of the implant. Therefore, implant stability has to be adequate after insertion in the mouth for obtaining adequate osseointegration.3
Bone density determines the force required for dental implant insertion in bone. Other factors like size of the orifice and compressive stresses generated at the junction of dental implant and bone can affect the force.4 Thus the stability of the dental implant is greatly affected by compression stresses. It is mentioned in previous data that higher forces lead to bone ischemia and necrosis at the implant–tissue interface. Lower forces result in improved stability of the implant. Better osseointegration may result from selecting appropriate dental implants that comprise of correct implant size selection such as width and height.5
Continuous monitoring is the new concept of assessing implant stability which has replaced the old idea of microscopic or histologic analysis.6 In this study, we evaluated and compared the implant stability and torque insertion of two different implant macrogeometry in different bone densities quotient using resonance frequency analysis.
MATERIALS AND METHODS
Sample Selection
The present experimental study was done in the department of Prosthodontics. In this in vitro study, we used 2 × 2 × 13 cm of four bone blocks of dense inflexible polyurethane foam of thickness 1, 2, and 3 mm and the fourth is completely cortical block. Since the 0.31 g/cm³ is the average bone mineral density for the posterior maxilla and 0.55 g/cm³ for the maxillary anterior area, hence 0.48 g/ m³ bone density polyurethane foam blocks were selected. Short fiber-filled epoxy sheets were involved as a cortical bone substitute. Two designs of the implant were as follows; the first one had trapezoidal threads having morse taper connection and a cervical portion with one millimeter of plane alignment (regular) and the second implant had similar characteristics plus healing chambers in the threads (new).
Surface Treatment
Surface treatment was given with a blasting process plus acid conditioning. Following this, blasting with titanium dioxide (TiO2) microparticles having 45 to 110 µm size was done. Final conditioning was performed with a solution of maleic acid proceeded by washing with water.
The surface roughness and morphology of four dental implants from each group were evaluated with atomic force microscopy and scanning electron microscopy. An optical laser profilometer was used for measuring surface roughness.
Grouping of Implants
We divided 48 implants into 4 groups (12 samples in each group) based on the design as well as surface treating. Group A had regular conical design which did not undergo surface treatment, group B had normal conical plan which underwent surface treating, group C was new conical design that did not undergo surface treating, and group D was novel conical plan which underwent surface treating.
Experimental Design
Implants were placed in homogeneous bone blocks with different bone densities following osteotomy preparation with a sequence of drilling was initially 2 mm drill, 3.5 mm conical drill, and 4.0 mm conical drill. A rise in the numerical size of the bone blocks denoted a raise in the bone density. Calculation of the implant stability quotient (ISQ) and IT scores was repetitive of four times for each bone density. In groups A, B, and C, the association between the implant stability and IT according to the size of the final drill diameter used was assessed. In group D, the association between the implant stability and IT conferring to the size of the final drill diameter (4 mm) in the bone blocks with an even cortical thickness of 1.5 mm was estimated.6
Preparation, Osteotomy, and Fixture Installation
All of the osteotomies were performed with a tender surgical method using a bench drill with a force of 20 N having 1000 rpm speed with external abundant cooling. Following this, all implants were installed with a computed torquimeter machine.
Measurements of IT and RT
While connection, the peak IT was calculated for all tested implants, following the final seating of the fixtures using the Osstell Mentor (Osstell, Göteborg, Sweden). Each implant stability was measured in ISQ units. The RF values were symbolized in the ISQ in a scale from 1 to 100 and were averaged for each implant. Each measurement was performed up to four times and average of it was taken as final value.6 The torque reduction (TR) percentage was calculated as TR = insertion torque (IT)/removal torque (RT) = 100%/X.
Statistical Analysis
Data were tabulated and entered in MS excel sheet for inference using SPSS version (21.0). Results were interpreted as mean and standard deviations. p value lower to 0.05 was deliberated substantial.
RESULTS
Table 1 shows that group A had steady conical plane deprived of surface treating, group B had normal conical design with surface treating, group C was novel conical plane deprived of surface treating, and group D was novel conical outline with surface treating.
| Groups | Group A | Group B | Group C | Group D |
|---|---|---|---|---|
| Design | Regular conical deprived of surface treating | Regular conical with surface treating | New conical deprived of surface treating | New conical with surface treating |
| Number | 12 | 12 | 12 | 12 |
Table 2 shows that mean ± SD ISQ value of bone 1 in group A was 56.7 ± 3.2, in group B was 58.6 ± 2.4, in group C was 57.1 ± 3.5, and in group D was 59.3 ± 2.9. In bone 2, the value was 57.8 ± 1.4, 59.5 ± 1.5, 58.2 ± 2.6, and 59.5 ± 2.4 among A, B, C, and D groups correspondingly. In bone 3, it was 59.4 ± 2.4, 60.3 ± 2.3, 60.4 ± 2.8, and 62.7 ± 2.5 among A, B, C, and D groups correspondingly. In bone 4, it was 67.2 ± 3.4, 69.5 ± 2.7, 68.7 ± 2.4, and 69.4 ± 2 among A, B, C, and D groups correspondingly.
| Parameters | Bone 1 | Bone 2 | Bone 3 | Bone 4 |
|---|---|---|---|---|
| Group A | 56.7 ± 3.2 | 57.8 ± 1.4 | 59.4 ± 2.4 | 67.2 ± 3.4 |
| Group B | 58.6 ± 2.4 | 59.5 ± 1.5 | 60.3 ± 2.3 | 69.5 ± 2.7 |
| Group C | 57.1 ± 3.5 | 58.2 ± 2.6 | 60.4 ± 2.8 | 68.7 ± 2.4 |
| Group D | 59.3 ± 2.9 | 59.5 ± 2.4 | 62.7 ± 2.5 | 69.4 ± 2.3 |
| p value | 0.12 | 0.15 | 0.24 | 0.31 |
Table 3 shows that mean ± SD IT value of bone 1 was 13.2 ± 2.2, 13.6 ± 2.3, 1.4 ± 2.5, and 11.8 ± 2.6 among A, B, C, and D groups correspondingly. In bone 2, it was 16.1 ± 1.5, 16.3 ± 1.6, 13.2 ± 2.3, and 13.5 ± 2.5 among A, B, C, and D groups correspondingly. In bone 3, it was 19.2 ± 2.6, 20.3 ± 2.8, 15.2 ± 3.2, and 16.4 ± 3.6 among A, B, C, and D groups correspondingly. In bone 4, it was 29.8 ± 2.4, 30.5 ± 2.7, 25.7 ± 3.4, and 26.4 ± 3.6 among A, B, C, and D groups correspondingly.
| Parameters | Bone 1 | Bone 2 | Bone 3 | Bone 4 |
|---|---|---|---|---|
| Group A | 13.2 ± 2.2 | 16.1 ± 1.5 | 19.2 ± 2.6 | 29.8 ± 2.4 |
| Group B | 13.6 ± 2.3 | 16.3 ± 1.6 | 20.3 ± 2.8 | 30.5 ± 2.7 |
| Group C | 11.4 ± 2.5 | 13.2 ± 2.3 | 15.2 ± 3.2 | 25.7 ± 3.4 |
| Group D | 11.8 ± 2.6 | 13.5 ± 2.5 | 16.4 ± 3.6 | 26.4 ± 3.6 |
| p value | 0.05 | 0.02 | 0.01 | 0.01 |
Table 4 shows that mean± SD RT value of bone 1 was 6.4 ± 1.3, 6.9 ± 1.7, 6.6 ± 1.4, and 6.7 c 1.2 among A, B, C, and D groups correspondingly. In bone 2 was 7.2 ± 1.2, 7.4 ± 1.4, 7.3 ± 1.6, and 7.5 ± 1.7 among A, B, C, and D groups correspondingly. In bone 3, it was 8.4 ± 1.2, 9.7 ± 1.3, 8.2 ± 1.4, and 8.4 ± 1.6 among A, B, C, and D groups correspondingly. In bone 4, it was 20.3 ± 1.23, 20.5 ± 1.4, 18.3 ± 1.4, and 19.3 ± 1.2 among A, B, C, and D groups correspondingly. The variance was nonsubstantial (p > 0.05). It is found that RT values were 45.2% smaller than the torque insertion for the groups with normal macrogeometry (group A and group B) and 38.6% for the groups with the novel implant macrogeometry (group C and group D).
| Parameters | Bone 1 | Bone 2 | Bone 3 | Bone 4 |
|---|---|---|---|---|
| Group A | 6.4 ± 1.3 | 7.2 ± 1.2 | 8.4 ± 1.2 | 20.3 ± 1.3 |
| Group B | 6.9 ± 1.7 | 7.4 ± 1.4 | 9.7 ± 1.3 | 20.5 ± 1.4 |
| Group C | 6.6 ± 1.4 | 7.3 ± 1.6 | 8.2 ± 1.4 | 18.3 ± 1.4 |
| Group D | 6.7 ± 1.2 | 7.5 ± 1.7 | 8.4 ± 1.6 | 19.3 ± 1.2 |
| p value | 0.91 | 0.82 | 0.72 | 0.65 |
Figure 1 shows that there was significant difference (p < 0.05) in mean torque insertion values of two implant macrogeometries (regular, new) in different bone types. Table 5 shows that TR percentage in groups A and B found to be 52% and in groups C and D was 40% in bone type 1. In bone type 2, it was 54% and 46 among A, B, C, and D groups correspondingly. In type 3 bone, it was 53% and 48% among A, B, C, and D groups correspondingly. In type 4 bone, it was 33% in all groups.
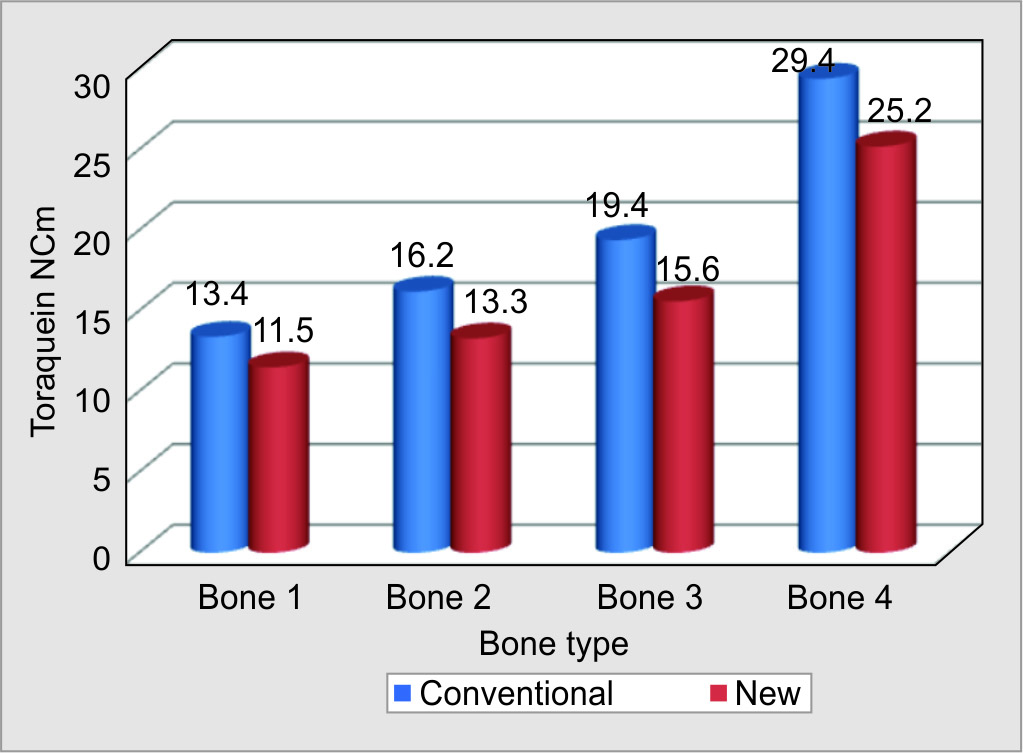
Fig. 1: Insertion torque values in two implant macrogeometries
| Bone type | Group A and Group B | Group C and Group D |
|---|---|---|
| 1 | 52 | 40 |
| 2 | 54 | 46 |
| 3 | 53 | 48 |
| 4 | 33 | 33 |
Table 6 shows that there was no correlation existed between torque insertion and stability (ISQ) values in all groups.
| Groups | Bone 1 | Bone 2 | Bone 3 | Bone 4 |
|---|---|---|---|---|
| Group A | R = 0.32, p-0.41 | R = −0.23, p-0.42 | R = −0.31, p- 0.41 | R = −0.47, p-0.01 |
| Group B | R = 0.36, p-0.42 | R = 0.09, p-0.92 | R = −0.72, p-0.42 | R = −0.16, p-0.82 |
| Group C | R = 0.04, p-0.12 | R = −0.54, p-0.04 | R = −0.43, p-0.12 | R = −0.43, p-0.42 |
| Group D | R = 0.07, p-0.81 | R = 0.42, p-0.32 | R = −0.05, p-0.81 | R = −0.32, p-0.45 |
DISCUSSION
Surface treatment of dental implants significantly enhances the chances of success. Titanium dioxide is widely used for this purpose.7 We evaluated and compared the IT and the implant stability of two different implant macrogeometry, i.e., regular and new in different bone densities quotient using resonance frequency analysis.
Jimbo et al.8 suggested that new macrogeometry increases the osseointegration. We used new macrogeometry implants having healing chambers. This design helped in decompression of bone by creating spaces. This is helpful in obtaining better implant stability.
Gehrke et al. assessed the RT, IT, and the stability of implant using RFA in dissimilar polyurethane block masses of two implant macrogeometries. Authors found nonsignificant differences (p > 0.05) in ISQ values in all bone models. It was 57.7 ± 3.0 in bone type 1, 58.6 ± 2.2 in bone 2, 60.6 ± 2.3 in bone 3, and 68.5 ± 2.8 in bone 4. Regular macrogeometry implant exhibited higher values of IT compared to new implant macrogeometry without disturbing the values of implant stability. They concluded that primary stability depends on both bone quality and IT.9 This is in accordance to our findings.
Implant stability may be decided by means of RFA method with Osstell Mentor. This is simple and precise chair side portable, hand-held diagnostic device, commonly used in clinical practice to assess impeding failure and to measure implant stability. Using this method data can be recorded. It works on the magnetic frequencies. RFA is a clinical technique which can quantitatively evaluate primary implant stability so as to recognize implants with little stability and to take precautions to develop it to choose on healing method (one stage or two stages), to adopt for suitability of instant/early loading, and to decide healing time before loading.2 Sennerby et al. stated in their review article that the RFA method can be used at any stage of implant treatment as supplementary parameter to upkeep conclusion-making.10 Gehrke et al. found RFA as an effective noninvasive method to evaluate implant stability.9 Similarly Kanth et al.,2 Satwalekar et al.,11 and Bafijari et al.12 stated that RFA is non-invasive, reliable clinically, user-friendly method which has repeatability, reproducibility, and reliable for identifying risk of implant failure and implant stability during early healing.
We found that significant difference in IT value in all bone types for all groups. Acil et al.13 found that macrogeometry, such as design and topography, affects the interaction between dental implants and bone. It is also mentioned that surface treatment of dental implants can determine the implant stability.
We found that RT value was comparatively higher in bones 3 and 4 as compared to bones 1 and 2 in all groups. We observed that RT values were 45.2% smaller than the torque insertion for the groups with normal macrogeometry (groups A and B). It is due to the fact that there is decrease in stress on bone because of availability of decompression chambers. As reported by Ahn et al.,14 limited viscoelastic possessions of the neighboring artificial bone outcomes in the variance between torque insertion and torque removal. This leads to less resistance during removal. Less viscosity was seen in bone 4 whereas more viscous was seen in bone 3 having greater TR.
In our study, it was evident that TR percentage was 52% in groups A and B and 40% in groups C and D in type 1 bone. In type 2 bone, it was 54% and 46% among A, B, C, and D groups correspondingly. In contrast to our results, Gedrange et al. suggested that various surface treatments of dental implants may not always be detected by RFA and this technique has low sensitivity. The value of resonance frequency is affected by both the level of the bone surrounding the fixture and the stiffness of the interface between implant and bone.15
In present study, we did not find correlation between torque insertion and stability (ISQ) scores in all groups. Our results are in association with various studies which mentioned that the higher bone density scores produce a higher option of decreasing the initial torque calculated by the viscosity of tissue.16,17
The limitation of the study is small sample size and it has not compared the other noninvasive technique to check implant stability and the study was in vitro evaluation. Further clinical studies are in need for to evaluate the accuracy of RFA, torque value, and implant stability.
CONCLUSION
Low IT of new implant types is useful to reduce failure as compared to regular implant macrogeometry. There was no association between insertion torque and stability of implant. With respect to clinical relevance, calculation of insertion torque score helps in implant placement and to reduces the risk of implant failure. Higher bone density scores produce a higher option of decreasing the initial torque. Future prospects should be directed for resonance frequency analysis since it is reliable, simple device used for assessment of dental implant stability. Large scale studies are required to substantiate further utility.
REFERENCES
1. Baldi D, Lombardi T, Colombo J, et al. Correlation between insertion torque and implant stability quotient in tapered implants with knife-edge thread design. BioMed Res Int 2018;2018:7201093. DOI: 10.1155/2018/7201093.
2. Kanth KL, Swamy DN, Mohan TK, et al. Determination of implant stability by resonance frequency analysis device during early healing period. J NTR Univ Health Sci 2014;3:169–175. DOI: 10.4103/2277-8632.140936.
3. Stacchi C, Vercellotti T, Torelli L, et al. Changes in implant stability using different site preparation techniques: twist drills versus piezosurgery: a single-blinded, randomized, controlled clinical trial. Clin Implant Dent Relat Res 2013;15:188–197. DOI: 10.1111/j.1708-8208.2011.00341.x.
4. Nedir R, Bischof M, Szmukler-Moncler S, et al. Predicting osseointegration by means of implant primary stability. Clin Oral Implants Res 2004;15:520–528. DOI: 10.1111/j.1600-0501.2004.01059.x.
5. Javed F, Romanos GE. The role of primary stability for successful immediate loading of dental implants. A literature review. J Dent 2010;38:612–620. DOI: 10.1016/j.jdent.2010.05.013.
6. Bayarchimeg D, Namgoong H, Kim BK, et al. Evaluation of the correlation between insertion torque and primary stability of dental implants using a block bone test. J Periodontal Implant Sci 2013;43:30–36. DOI: 10.5051/jpis.2013.43.1.30.
7. Devlin H, Horner K, Ledgerton DA. Comparison of maxillary and mandibular bone mineral densities. J Prosthet Dent 1998;79:323–327. DOI: 10.1016/s0022-3913(98)70245-8.
8. Jimbo R, Tovar N, Anchieta RB, et al. The combined effects of undersized drilling and implant macrogeometry on bone healing around dental implants: an experimental study. Int J Oral Maxillofac Surg 2014;43:1269–1275. DOI: 10.1016/j.ijom.2014.03.017.
9. Gehrke SA, Pérez-Díaz L, Mazón P, et al. Biomechanical effects of a new macrogeometry design of dental implants: an in vitro experimental analysis. J Funct Biomater 2019;10(4):47. DOI: 10.3390/jfb10040047.
10. Sennerby L. Resonance frequency analysis for implant stability measurements. A review. Integr Diagn Update 2015;1:1–11. DOI: 10.4103/jdi.jdi_7_18.
11. Satwalekar P, Nalla S, Reddy R, et al. Clinical evaluation of osseointegration using resonance frequency analysis. Indian Prosthodont Soc 2015;15:192–199. DOI: 10.4103/0972-4052.165171.
12. Bafijari D, Benedetti A, Stamatoski A, et al. Influence of resonance frequency analysis (RFA) measurements for successful osseointegration of dental implants during the healing period and its impact on implant assessed by Osstell mentor device. Open Access Maced J Med Sci 2019;7(23):4110–4115. DOI: 10.3889/oamjms.2019.716.
13. Acil Y, Sievers, J, Gülses A, et al. Correlation between resonance frequency, insertion torque and bone-implant contact in self-cutting threaded implants. Odontology 2017;105:347–353. DOI: 10.1007/s10266-016-0265-2.
14. Ahn SJ, Leesungbok R, Lee SW, et al. Differences in implant stability associated with various methods of preparation of the implant bed: an in vitro study. J Prosthet Dent 2012;107:366–372. DOI: 10.1016/S0022-3913(12)60092-4.
15. Gedrange T, Hietschold V, Mai R, et al. An evaluation of resonance frequency analysis for the determination of the primary stability of orthodontic palatal implants. A study in human cadavers. Clin Oral Implants Res 2005;16:425–431. DOI: 10.1111/j.1600-0501.2005.01134.x.
16. Sennerby L, Meredith N. Implant stability measurements using resonance frequency analysis: biological and biomechanical aspects and clinical implications. Periodontology 2008;47:51–66. DOI: 10.1111/j.1600-0757.2008.00267.x.
17. Rabel A, Köhler SG, Schmidt-Westhausen AM. Clinical study on the primary stability of two dental implant systems with resonance frequency analysis. Clin Oral Investig 2007;11:257–265. DOI: 10.1007/s00784-007-0115-2.
________________________
© The Author(s). 2021 Open Access This article is distributed under the terms of the Creative Commons Attribution 4.0 International License (https://creativecommons.org/licenses/by-nc/4.0/), which permits unrestricted use, distribution, and non-commercial reproduction in any medium, provided you give appropriate credit to the original author(s) and the source, provide a link to the Creative Commons license, and indicate if changes were made. The Creative Commons Public Domain Dedication waiver (http://creativecommons.org/publicdomain/zero/1.0/) applies to the data made available in this article, unless otherwise stated.